Thank you Boris!
Is this what you mean?

Is this what you mean?
That is exactly what I am talking about! Now I have to see how you transpose a spreadsheet. Give me a second
Found it......
Hi BorisFound it......
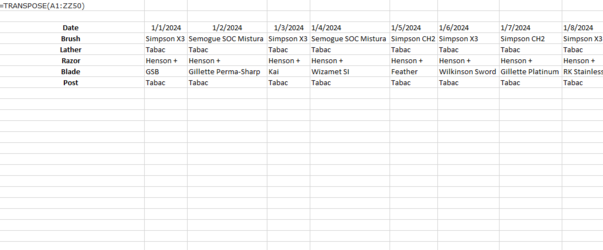
Once you have all your data in there you can transpose by using this command
=TRANSPOSE(<left upper most cell>: <right lower most cell>) This should flip the row and columns for you and you are set!
Very cool! Now you are cooking with gas! The error message could be that there was not enough room for your transposed data. The command I shared will generate a second copy of your data. However your figured out a different way. Awesome! Now you can just add your new shave data to the bottom of this list and you can manipulate and look at your data in many different ways.Once I selected Close and Load my spreadsheet looks like this:
Much nicer!! Thank you!!!
View attachment 1844067
Thank you very much Boris! This is fantastic! You guys are awesome!!Very cool! Now you are cooking with gas! The error message could be that there was not enough room for your transposed data. The command I shared will generate a second copy of your data. However your figured out a different way. Awesome! Now you can just add your new shave data to the bottom of this list and you can manipulate and look at your data in many different ways.
I'm so happy that we were able to help you out. Granted you really did the leg work. The Google sheets and excel are really powerful in manipulating data.Thank you very much Boris! This is fantastic! You guys are awesome!!
 ).
).With the way I actually worded these weights the numbers might have to be reversed because end result is more or less a given for me. Hence more emphasis is then put on quality or comfort.The weights I have attached to each of these scores is 1 for Quality (I don´t like to draw blood obviously, but it is also part of life, and my technique is currently as such that it's no longer havoc and mayhem), 4 for Comfort and 5 for End result (I am most OCD about that - why would I else want to shave?)

I'm so happy that we were able to help you out. Granted you really did the leg work. The Google sheets and excel are really powerful in manipulating data.
You might want to take the next step and maybe add a column or two for some numerical shave ratings going forward. That way you open up the possibility for lot more ways to look at the data. Blade and razor performance etc etc.
That's a great suggestion! I think for starters I'll add one column which will include a shave rating from 1 to 0 where 10 is off the charts awesome while one is as bad as it can get.I'm so happy that we were able to help you out. Granted you really did the leg work. The Google sheets and excel are really powerful in manipulating data.
You might want to take the next step and maybe add a column or two for some numerical shave ratings going forward. That way you open up the possibility for lot more ways to look at the data. Blade and razor performance etc etc.
Looks great Paul! If I were you I would transpose your dataset again to have line items per date rather than having the dates in columns - that will make it easier to glance at.Ok I just added a column for ratings. Ran the Power Query to transpose:
View attachment 1844527
Resultant data:
View attachment 1844526
That's a cool way to look at things if we want to put weights on certain criterion and emphasize those things that are more important to us.In an attempt to make analysis easier I have introduced a new variable called Total which is a weighted average of Quality of the shave (for me meaning the amount of blood I am drawing), Comfort (level of smoothness) and end result (BBS, et cetera). The weights I have attached to each of these scores is 1 for Quality (I don´t like to draw blood obviously, but it is also part of life, and my technique is currently as such that it's no longer havoc and mayhem), 4 for Comfort and 5 for End result (I am most OCD about that - why would I else want to shave?). Combined these weights amount to 10 and so I calculate variable Total as [(Q*1)+(C*4)+(E*5)]/10. I then let Excel calculate the average T per razor and blade in my Pivotal Table.
If I then reverse sort these with the largest average on top there are definitely some changes in my Top 5 razors! For example while the Blackbird is the most effective razor overall, if I factor in Quality and Comfort there are times when the shave as a whole is less pleasant. So with a combined average of 9.12 the Mühle Rocca R94 is the razor that gives me the best shaves and also really consistently as the standard deviation is small as well. In blades there is also a shift with Eddison coming out as best blade followed by GSB (
Mind you these are raw scores, so I haven’t standardised anything.
Now if you do that for a few weeks we can start doing some averages and look at scores vs razor, blade etcOk I just added a column for ratings. Ran the Power Query to transpose:
View attachment 1844527
Resultant data:
View attachment 1844526
Thank you Guido! I will take a look to see if I can find that setting. Timing is great because I had an afternoon shave so I have more day at to enter!Looks great Paul! If I were you I would transpose your dataset again to have line items per date rather than having the dates in columns - that will make it easier to glance at.
But you have unique data in each cell so that’s the basis right there for you!
Excellent!
Guido